
EDGE C helps logistics, transportation, and mobility companies build AI systems that detect assets, monitor activity, map infrastructure, automate visual review, and turn operational data into structured intelligence.
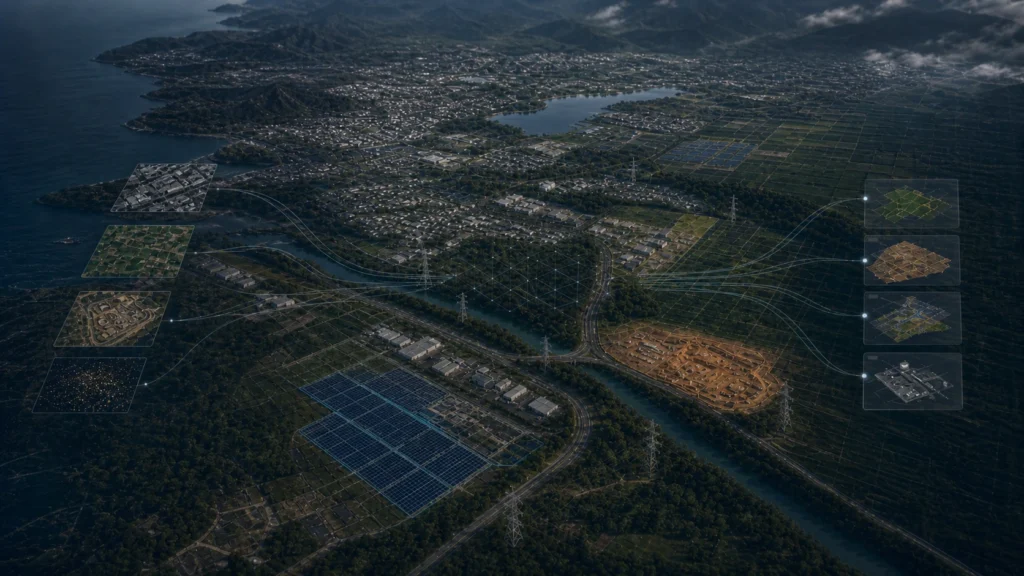
We work with satellite imagery, drone imagery, aerial data, CCTV/video feeds, GIS layers, inspection photos, fleet records, logistics data, infrastructure maps, and operational systems to help teams see what is happening across ports, roads, rail, warehouses, yards, hubs, terminals, and mobility networks.
From freight corridors and transport hubs to vehicle fleets, public mobility systems, ports, rail yards, airports, and last-mile operations, EDGE C builds visual intelligence systems that help teams monitor movement, detect change, reduce manual work, and make faster decisions.
Build smarter visibility across your logistics, transportation, and mobility operations.

Logistics, transportation, and mobility companies are operating in a world where speed, visibility, resilience, and automation matter more than ever.
Supply chains are more complex. Transportation infrastructure is under pressure. Customers expect faster delivery and better tracking. Ports, warehouses, rail networks, airports, yards, and fleets generate large volumes of visual, geospatial, and operational data every day.
The industry is shifting from manual tracking and disconnected systems toward real-time visibility, AI-assisted planning, automated monitoring, predictive operations, and data-driven decision-making.
According to CSCMP’s 2025 State of Logistics Report, produced by Kearney and presented by Penske Logistics, the report describes the logistics sector as operating through uncertainty and “fog,” highlighting the need for better visibility, planning, and resilience across supply chains. (CSCMP)
According to MarketsandMarkets, the global AI in supply chain market is projected to grow from USD 13.93 billion in 2025 to USD 50.41 billion by 2032, at a 20.2% CAGR, showing rising demand for automation, prediction, and intelligence across supply chain operations. (MarketsandMarkets)
According to Future Market Insights, the AI in transportation market is valued at USD 9 billion in 2025 and is projected to reach nearly USD 71 billion by 2035, growing at a 22.8% CAGR. (Future Market Insights)
For logistics, transportation, and mobility organizations, this shift creates a clear opportunity: use AI and visual intelligence to turn cameras, imagery, maps, fleet data, and operational records into intelligence that supports faster decisions.
Logistics and transportation operations are physical, distributed, and constantly changing. Vehicles move. Containers shift. Routes change. Yards fill and empty. Roads get blocked. Infrastructure ages. Weather, congestion, labor constraints, and disruptions affect performance.
Many teams still rely on manual inspections, static reports, disconnected dashboards, spreadsheets, radio updates, siloed transport systems, and delayed visual review.
That creates visibility gaps.
Common challenges include:
Transportation and logistics teams are under pressure to reduce delays, improve asset utilization, lower operating costs, and make operations more resilient.
Manual review and disconnected workflows slow teams down. When visibility is delayed, companies can miss congestion, underused assets, site bottlenecks, infrastructure risks, or changes that affect service levels.
According to Maersk’s 2025 Logistics Trend Map, logistics organizations are prioritizing trends such as AI, automation, visibility, resilience, and digitalization as they adapt to global supply chain complexity. (Maersk)
According to Forto’s Logistics Trend Compass 2025, based on a survey of 271 logistics, supply chain, and purchasing professionals, the industry is dealing with operational complexity, changing transport preferences, and varying levels of digitalization. (Forto)
According to Precedence Research, the global artificial intelligence in transportation market is estimated at USD 5.53 billion in 2025 and is projected to reach USD 34.83 billion by 2034, growing at a 22.70% CAGR. (Precedence Research)
Organizations that continue relying only on manual monitoring and disconnected tools risk:
The companies that move faster will be those that convert visual, geospatial, and operational data into decision-ready intelligence.
EDGE C builds AI-powered visual intelligence systems for logistics, transportation, and mobility operations.
We help teams convert raw visual, geospatial, and operational data into structured intelligence. Instead of relying only on manual review, disconnected dashboards, or static reports, your teams can use AI systems to detect assets, classify activity, monitor movement, trigger alerts, generate reports, and query operational data.
EDGE C can help build systems that:
EDGE C does not sell logistics data, satellite data, or hardware. We help you build intelligence layers using your own data, third-party data, available visual/geospatial data, and operational systems.
For Logistics, Transportation & Mobility, relevant data sources may include:
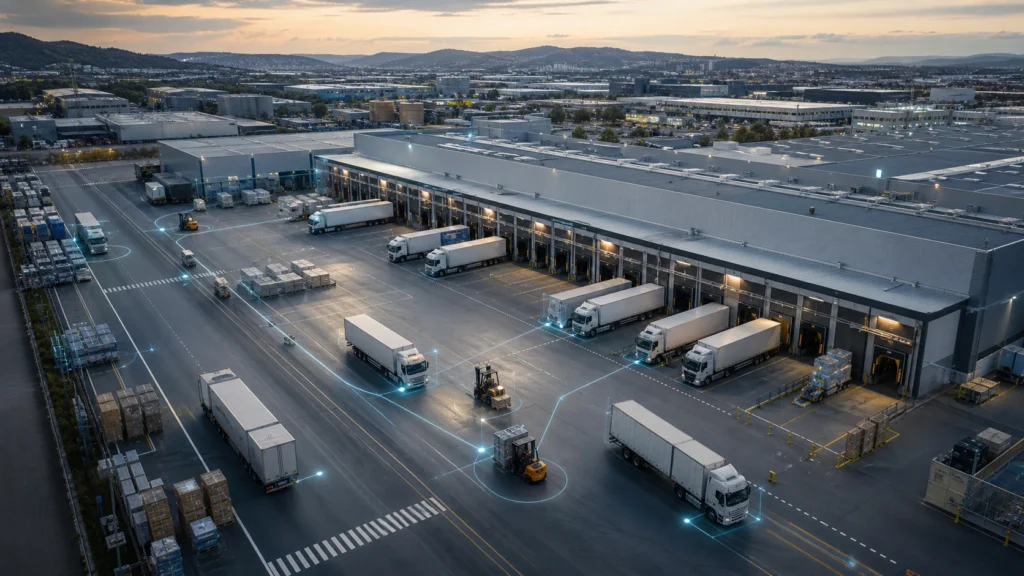
1. Yard and Terminal Visibility
EDGE C can help detect trucks, trailers, containers, equipment, loading zones, and congestion patterns from CCTV, drone imagery, aerial imagery, or satellite data.
Business value: Improve asset visibility, reduce manual yard checks, and help teams identify bottlenecks faster.
2. Port and Intermodal Monitoring
Monitor container movement, storage areas, gate activity, rail connections, cargo zones, and terminal changes across ports and intermodal hubs.
Business value: Support better planning, faster issue detection, and clearer operational reporting across complex logistics environments.
3. Fleet and Vehicle Detection
Use AI to detect vehicle presence, queues, parking occupancy, idle assets, restricted-zone activity, and movement patterns from visual and geospatial data.
Business value: Improve fleet visibility, reduce manual monitoring, and support faster decisions across distributed operations.
4. Road and Infrastructure Monitoring
Analyze imagery and video to detect road features, route obstructions, damaged surfaces, construction zones, traffic buildup, and infrastructure changes.
Business value: Help transportation teams prioritize inspections, improve route awareness, and respond faster to disruptions.
5. Warehouse and Distribution Site Intelligence
Monitor facility exteriors, loading docks, staging areas, parking lots, access routes, and delivery activity using cameras, imagery, and operational data.
Business value: Improve site visibility, support throughput analysis, and identify operational constraints before they affect service levels.
6. Change Detection Across Logistics Sites
Compare historical and current imagery to detect new construction, layout changes, added storage areas, changed traffic patterns, or new operational activity.
Business value: Keep site records current and help teams understand how physical operations are evolving over time.
7. Automated Incident and Operations Reporting
Generate structured reports from detected events, visual evidence, timestamps, asset locations, and operational metadata.
Business value: Reduce manual reporting effort and create clearer records for operations, safety, compliance, and management review.
EDGE C can help logistics, transportation, and mobility teams ask natural-language questions across their visual, geospatial, and operational data.
Example queries include:
Instead of manually searching through camera footage, maps, spreadsheets, and reports, teams can query a structured intelligence layer built from their own visual and operational data.
Logistics, Transportation & Mobility → AI Detection / Analysis → Structured Intelligence → Dashboards / APIs / Alerts / Reports / Query System
1. Data Ingestion
EDGE C helps ingest CCTV/video feeds, satellite imagery, drone imagery, aerial imagery, GIS layers, fleet records, telematics data, inspection photos, site maps, and operational datasets.
2. AI Detection & Classification
Computer vision models detect and classify relevant vehicles, containers, cargo areas, infrastructure, road features, activity patterns, risks, and site changes.
3. Structured Dataset Creation
Detected objects and events are converted into structured datasets with location, timestamp, object type, movement status, zone reference, confidence score, and supporting metadata.
4. Monitoring & Change Detection
The system monitors live or historical data to identify congestion, asset movement, site changes, blocked routes, new activity, repeated incidents, or operational risk signals.
5. Delivery Layer
Insights are delivered through dashboards, GIS-ready layers, APIs, alerts, automated reports, map interfaces, or natural-language query systems.
EDGE C can help logistics, transportation, and mobility organizations build:
Logistics, transportation, and mobility organizations already have access to valuable visual, geospatial, and operational data. The next step is turning that data into structured intelligence that helps teams monitor assets, detect bottlenecks, reduce manual work, and respond faster.
EDGE C helps you build AI systems that connect imagery, cameras, maps, fleet records, and operational data into practical tools your teams can use.
Build a Logistics Intelligence Layer

Tell us about your project. We’ll be in touch soon.
To get register with Edgec please send a request on below email, Thank you!
info@edgec.io