
EDGE C helps energy, utility, and natural resources companies detect, map, monitor, and query critical assets using satellite imagery, drone imagery, aerial data, CCTV/video feeds, GIS layers, inspection photos, and operational records.
From grid infrastructure and renewable assets to pipelines, substations, mining sites, field operations, and environmental risk zones, we build AI systems that convert visual data into structured intelligence your teams can act on.
Build a clearer, faster, and more scalable way to monitor your assets, sites, and operations.
Energy, utilities, and natural resources companies are operating in a more complex environment than ever before. Assets are distributed across large territories. Infrastructure is aging. Renewable energy capacity is expanding. Grid demand is rising. Field operations are becoming more data-heavy. Compliance, safety, and environmental expectations continue to increase.
At the same time, companies now have access to more visual and geospatial data than their teams can manually process.
Satellite imagery, drone inspections, aerial surveys, CCTV feeds, GIS layers, thermal imagery, field photos, and historical imagery can reveal where assets are located, what condition they are in, what changed, and where risk is emerging.
The challenge is no longer just collecting data. The challenge is turning that data into usable intelligence.
According to the International Energy Agency, global energy investment is expected to reach USD 3.3 trillion in 2025, with around USD 2.2 trillion going into renewables, nuclear, grids, storage, low-emissions fuels, efficiency, and electrification. (IEA)
According to the IEA, investment in the electricity sector is set to reach USD 1.5 trillion in 2025, around 50% higher than spending on bringing oil, natural gas, and coal to market. (IEA)
According to ResearchAndMarkets, the global geospatial analytics market is projected to grow from USD 32.97 billion in 2024 to USD 55.75 billion by 2029, at an 11.1% CAGR, showing rising demand for location-based intelligence across sectors including energy and utilities. (Business Wire)
For energy, utilities, and natural resources companies, this shift creates a clear opportunity: use AI and visual intelligence to understand assets, sites, risks, and changes faster than manual workflows allow.
Energy, utilities, and natural resources operations are difficult to monitor because they are physical, distributed, and constantly changing. Many organizations rely on manual inspections, disconnected GIS systems, spreadsheets, field reports, and delayed visual reviews.
That creates visibility gaps.
Common challenges include:
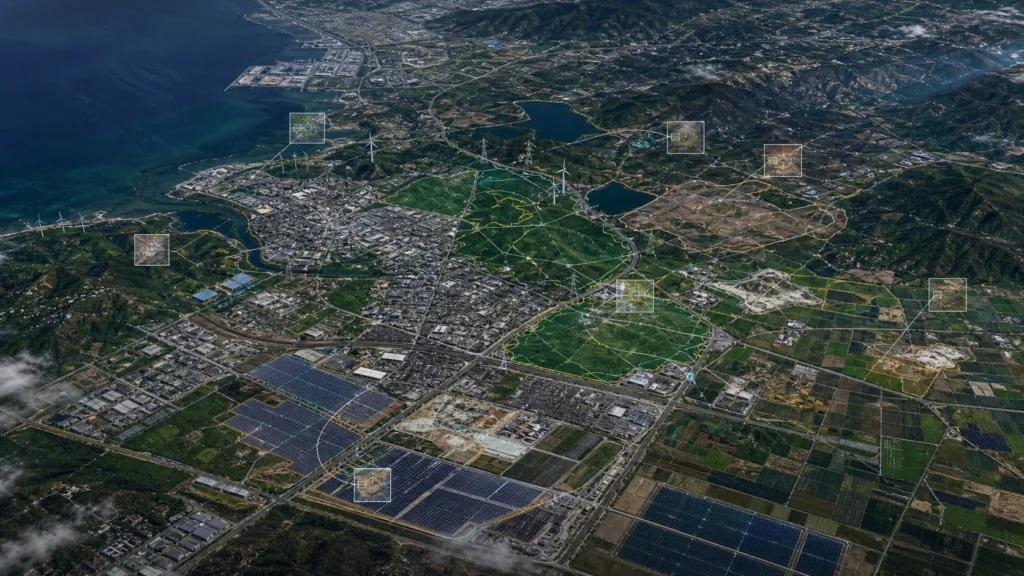
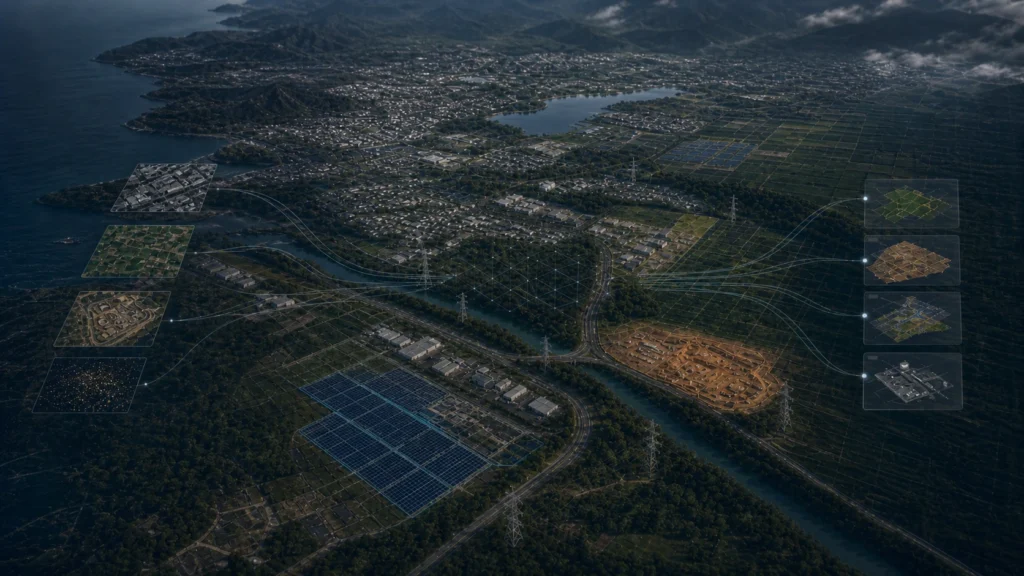
[Image space: Section visual showing manual inspection data, GIS layers, satellite imagery, and AI-detected assets being unified into one intelligence layer.]
The industry is entering a period where infrastructure scale, electrification, operational risk, and investor pressure are all increasing at the same time.
According to the IEA, global electricity demand is rising rapidly in the “Age of Electricity,” increasing the need for expanded grid capacity and better management of electricity infrastructure. (IEA)
According to Deloitte’s 2025 Oil and Gas Industry Outlook, oil and gas companies are navigating geopolitical uncertainty, energy transition pressure, and a continued push for production efficiency and technology investment. Deloitte also notes that industry capital expenditures increased by 53% over the last four years, while net profit rose by nearly 16%. (Deloitte)
According to BCG, AI is already helping oil and gas companies streamline operations, predict equipment failures, reduce process timelines from months to weeks, and improve performance across the value chain. (BCG Global)
Companies that continue relying only on manual inspections and disconnected workflows risk:
The companies that win will be the ones that turn visual and geospatial data into decision-ready intelligence.
EDGE C builds AI-powered visual intelligence systems for energy, utilities, and natural resources companies.
We help teams convert raw visual and geospatial data into structured, searchable, and actionable intelligence. Instead of manually reviewing imagery, inspection photos, or video feeds, your teams can use AI systems to detect objects, classify assets, monitor change, generate reports, trigger alerts, and query operational data.
EDGE C can help you build systems that:
EDGE C does not need to own proprietary datasets or sell satellite data. We help you build intelligence layers using your own data, third-party data, or available visual and geospatial data sources.
For Energy, Utilities & Natural Resources, relevant data sources may include:
Power & Utility Infrastructure
Transmission towers
Distribution poles
Power lines
Substations
Transformers
Switchyards
Utility corridors
Grid access roads
Vegetation near lines
Storm or wildfire exposure zones
1. Energy Infrastructure Detection
EDGE C can build systems that identify and map energy infrastructure from satellite, drone, aerial, or inspection imagery.
Business value: Create more complete asset visibility, improve GIS accuracy, and reduce manual mapping effort.
2. Utility Corridor Monitoring
Monitor transmission lines, poles, towers, substations, and surrounding vegetation across large service territories.
Business value: Improve risk visibility, prioritize inspections, and support faster maintenance planning.
3. Pipeline and Right-of-Way Monitoring
Detect pipeline corridors, nearby construction, land movement, surface disturbance, or unauthorized activity around critical routes.
Business value: Reduce blind spots across remote corridors and support proactive risk management.
4. Renewable Energy Site Monitoring
Track solar farms, wind sites, battery storage projects, construction progress, panel layouts, access roads, and land changes.
Business value: Improve project visibility, monitor expansion, and support operational reporting.
5. Mining Site Intelligence
Use aerial, drone, satellite, or historical imagery to monitor excavation areas, stockpiles, haul roads, tailings ponds, and site changes.
Business value: Improve operational visibility across large mining environments and support planning, compliance, and reporting workflows.
6. Change Detection Over Time
Compare historical and current imagery to detect what has changed across assets, sites, corridors, or regions.
Business value: Identify emerging risks, validate field activity, and reduce delays caused by manual image comparison.
7. Visual Inspection Automation
Analyze inspection photos, drone captures, or video frames to detect visible asset issues, missing components, damage, vegetation, or anomalies.
Business value: Reduce manual review time and help field teams focus on the locations that need attention first.
EDGE C can help energy, utility, and natural resources teams ask natural-language questions across visual and geospatial data.
Example queries include:
Instead of searching through folders, spreadsheets, static maps, or disconnected reports, teams can query a structured intelligence layer built from their visual and geospatial data.
Energy, Utilities & Natural Resources → AI Detection / Analysis → Structured Intelligence → Dashboards / APIs / Alerts / Reports / Query System
1. Data Ingestion
EDGE C helps ingest relevant data sources such as satellite imagery, drone imagery, aerial imagery, CCTV/video feeds, GIS layers, inspection photos, historical imagery, and internal asset records.
2. AI Detection & Classification
Computer vision models detect, classify, and tag relevant assets, objects, site features, risks, and changes specific to energy, utilities, and natural resources operations.
3. Structured Dataset Creation
Detected objects and findings are converted into structured datasets with location, category, confidence, timestamps, asset references, and metadata.
4. Monitoring & Change Detection
The system compares current and historical data to identify new activity, missing assets, changes in site condition, vegetation growth, construction, damage, or environmental risk.
5. Delivery Layer
Insights are delivered through dashboards, GIS-ready datasets, APIs, alerts, reports, or natural-language query tools, depending on how your teams work.
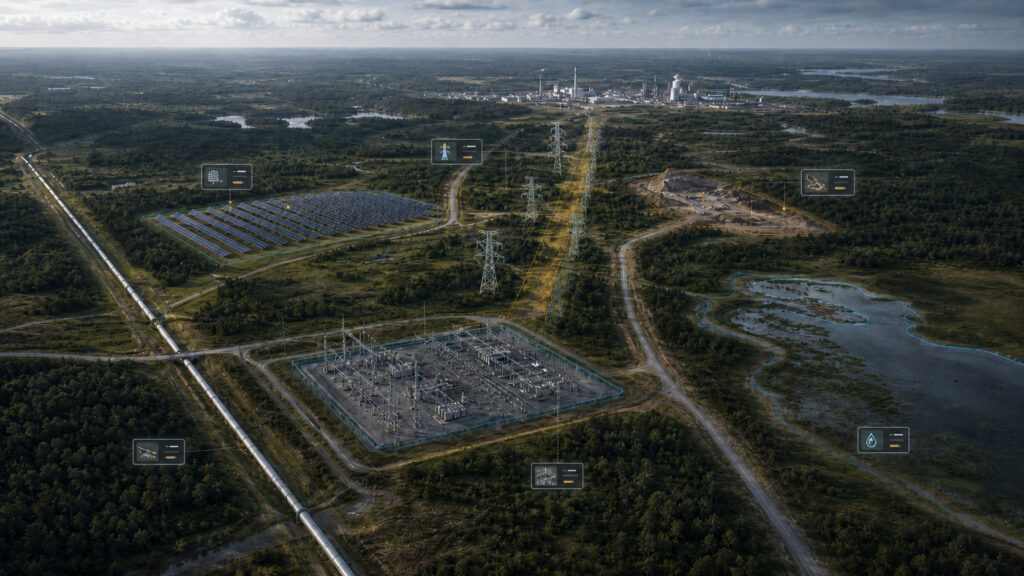
[Image space: Workflow diagram showing data sources entering an AI detection layer, then flowing into dashboards, alerts, reports, APIs, and natural-language queries.
EDGE C can help build practical AI systems and intelligence tools for Energy, Utilities & Natural Resources, including:
Energy, utilities, and natural resources companies already have access to valuable visual and geospatial data. The next step is turning that data into structured intelligence that helps teams detect assets, monitor change, reduce manual work, and make faster decisions.
EDGE C helps you build AI systems that connect imagery, maps, inspections, and operational data into tools your teams can actually use.
Tell us about your project. We’ll be in touch soon.
To get register with Edgec please send a request on below email, Thank you!
info@edgec.io