
Energy Asset Intelligence
Detect, track, and analyze energy infrastructure globally.
What is Energy Asset Intelligence?
Our AI system uses satellite imagery and computer vision to automatically detect, classify, and monitor energy infrastructure across the globe — without any manual effort.
- Automated asset detection from satellite data
- Real-time change monitoring & alerts
- Classifies oil rigs, pipelines, power plants & more
- API + dashboard delivery
- Works at global scale
Trusted by 20+ Companies





What We Can Detect & Monitor
From offshore rigs to power plants — our AI identifies any energy asset from imagery.
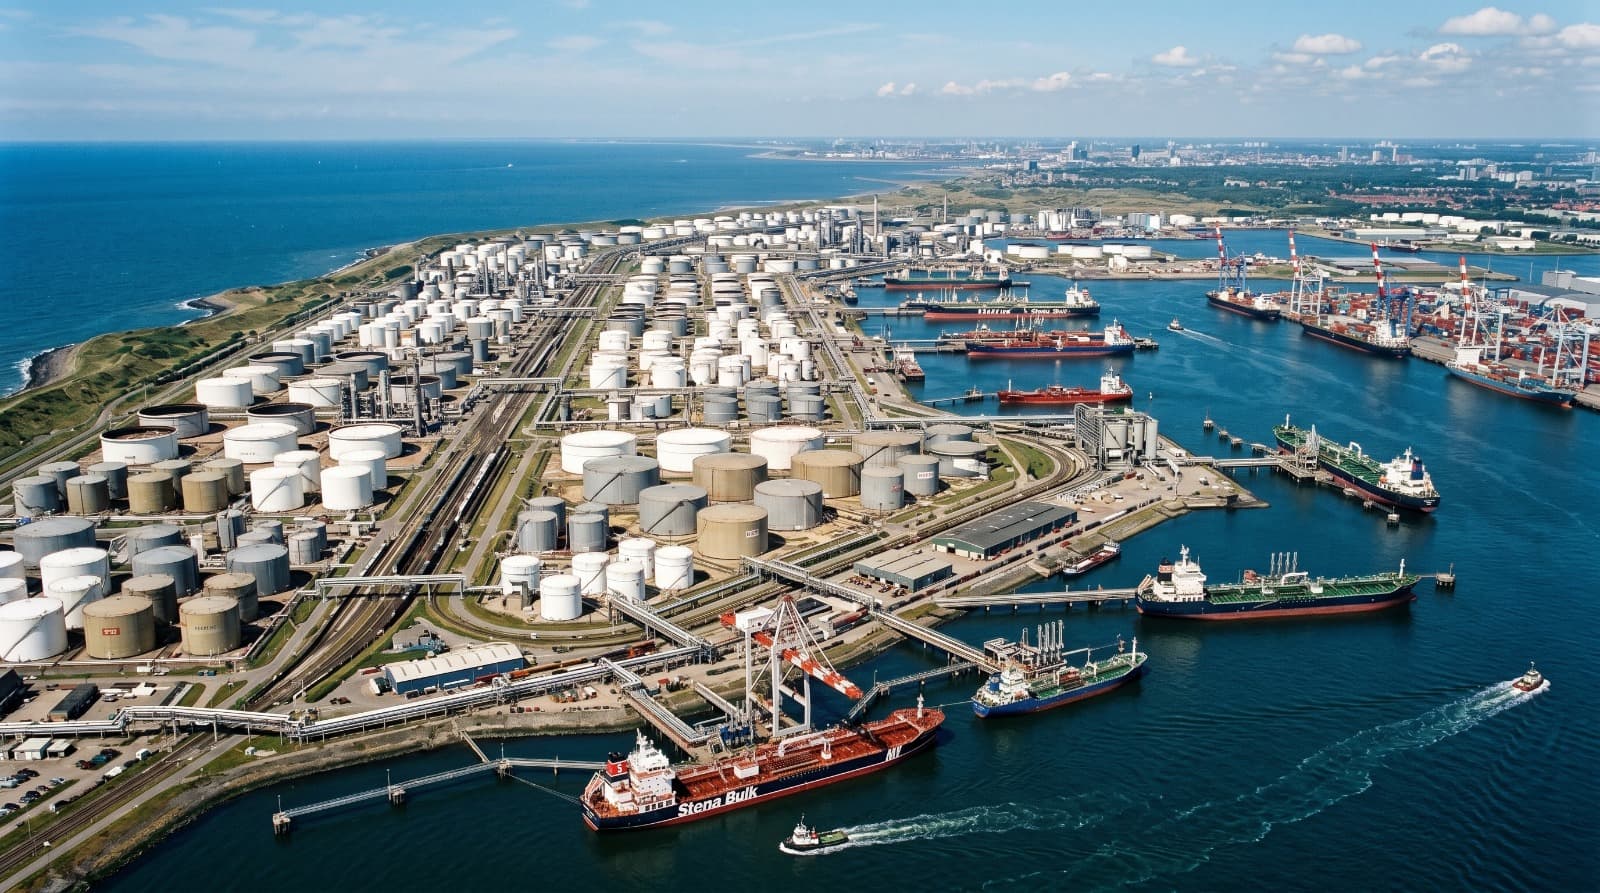
Oil & Gas Rigs
Detect onshore and offshore rig activity, identify operational status in real time.
Refineries
Monitor refinery operations, capacity utilization, and infrastructure changes.
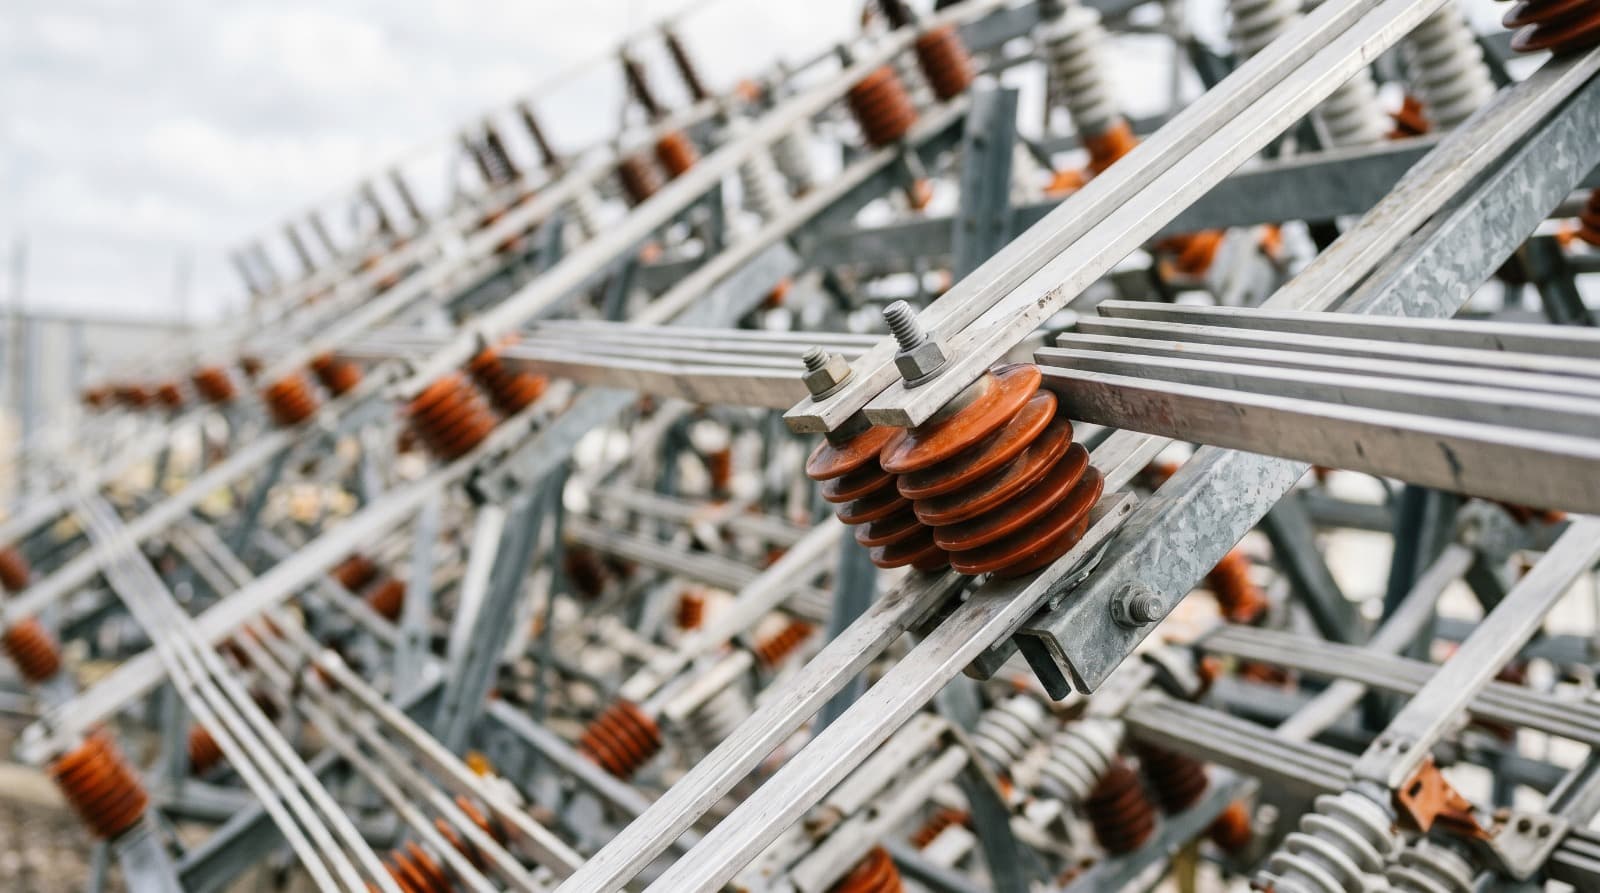
Power Plants
Classify plant types, identify output indicators, and track construction phases.
Pipelines
Map pipeline routes across geographies and detect anomalies or expansions.
Global Coverage
Monitor energy assets across any country, any terrain, at any scale.
Continuous Monitoring
Automated alerts whenever infrastructure changes are detected.
What You Get
Actionable intelligence delivered directly to your team.
Investment Insights
Identify emerging energy assets before they appear in public reports. Stay ahead of the market.
Market Intelligence
Track global supply chain shifts, infrastructure buildout trends, and competitor activity.
Risk Monitoring
Get early warnings on asset damage, shutdowns, or unusual operational activity.
Getting started
What you bring
Most engagements start with a region and a question, not a dataset.
- The territory or asset portfolio you need visibility over
- The asset classes in scope — rigs, refineries, plants, pipelines, storage
- Any internal asset registers to reconcile detections against
- How current the picture needs to be: one-off audit, or ongoing monitoring
How a deployment runs
- 01
Scope the territory
We establish the geographic boundary and the asset classes in scope, which together determine imagery sourcing, revisit cadence and cost.
- 02
Detect and classify
Computer vision models identify energy infrastructure and classify it by type and visible operational status, tagging each with coordinates and confidence.
- 03
Quantify where it matters
Where the question is about output rather than existence, structural characteristics extracted from imagery are combined with environmental data to produce grounded capacity estimates.
- 04
Monitor for change
Successive captures are compared so new construction, shutdowns, expansions and damage surface as events rather than as something someone notices later.
Questions
What teams usually ask first
Can you find assets that are not in public records?
Yes. Detection works from what is physically visible rather than from registries, which is why it surfaces infrastructure that regulatory data has missed or not yet recorded. On one regional mapping engagement this produced over 2,500 assets absent from local records.
How quickly can a regional audit be completed?
Far faster than a manual survey. A multi-state grid territory that was quoted at six months of helicopter flyovers and drone crews was mapped in 72 hours. Timelines depend on imagery availability for your region.
Can you estimate how much power an asset is producing?
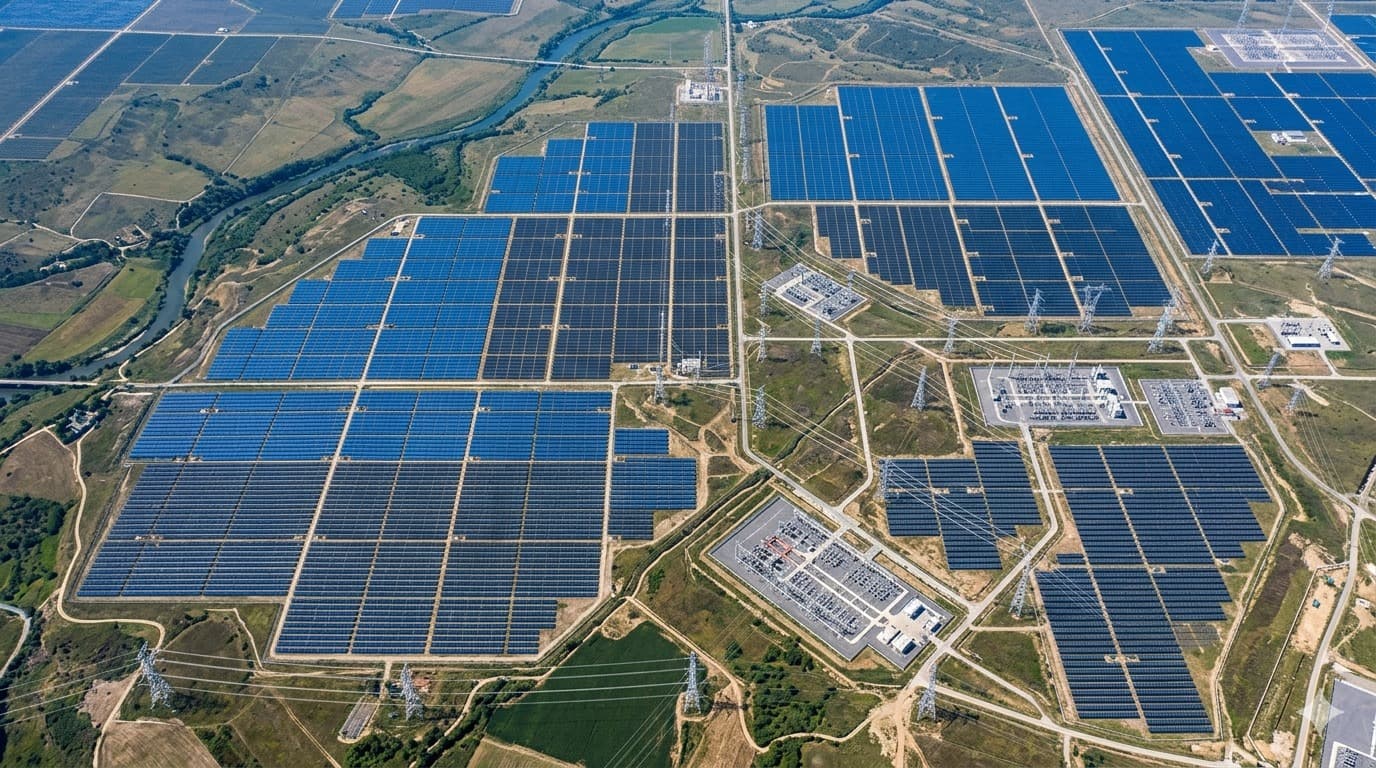
For solar, structural parameters visible from orbit — array geometry, string configuration, tilt angle — can be combined with localised irradiance and seasonal models to produce a physics-grounded generation estimate per site.
Does this work outside our home market?
Yes. Because the input is satellite imagery rather than local data infrastructure, coverage does not depend on a country having good public records — which is usually exactly when this is most valuable.
Where this has already been deployed
Real client deployments that use this capability, with the outcomes they produced.

Other Solutions
Get started
Book a call with us
Tell us what data you already have. We'll show you what an intelligence layer on top of it looks like.
- A 30-minute call, no prep needed on your side.
- Bring the data you already have — imagery, feeds, GIS layers, records.
- You leave with a concrete view of what an intelligence layer on top of it looks like.
Prefer to reach us directly?
Choose a time
The usual starting point. Walk us through your data and goals, and leave with a concrete view of what's buildable.
Loading available times…
Book a meeting on CalendlyTrouble booking? Open the scheduler in a new tab.